
Application performance magic.
Build, deploy, and maintain great software with New Relic APM.
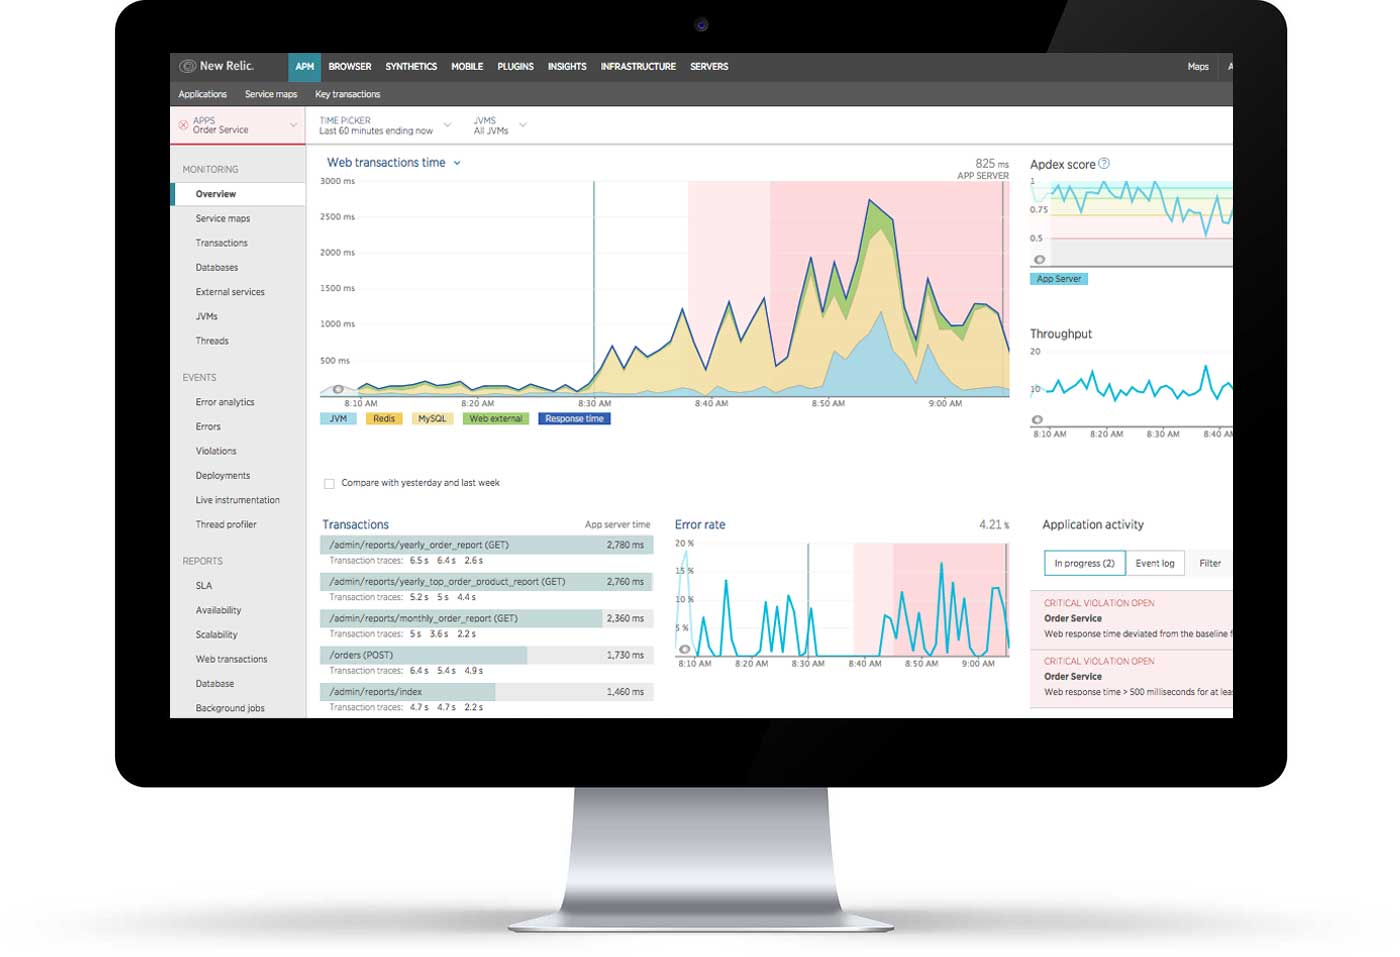
Better monitoring for better customer experiences
New Relic APM gives you detailed performance metrics for every aspect of your environment, in real-time.

Enable the new and never-been-done-before
It’s everything you need to quickly resolve issues, so you can focus on more important things.
End-to-end transaction tracing
Follow the performance of critical transactions across your entire service-oriented application environment.
Code-level visibility
Drill down for instant insights into specific code segments and SQL statements.
Key transactions
Flag your most critical transactions to see when things like response times, call counts, or error rates perform poorly.
Customizable Service Maps
Visualize performance metrics for distributed applications, architectures, and external services in one centralized map.
New Relic APM Features
This table shows APM features by product tier. View APM features by function.
| ESSENTIALS | PRO | |
|---|---|---|
APM Key Features |
||
| Response Time, Throughput, and Error Rates
Response time is an average of the total time spent across all web transactions occurring within a selected time frame on the server-side. Throughput is requests per minute through the application. Error rates measures the percentage of errors over a set time period for your application. |
||
| Database Monitoring: Metrics and SQL Analysis
Database metrics drill into an individual database call with specific details like response time and throughput, time consumption by caller, and slow SQL traces, all specific to that individual call (including stack traces from wherever the query was invoked). SQL query analysis allows you to track the exact SQL statements that are slowing down your site. |
||
| Filterable Error Analytics and Traces
Detailed info on what line of code caused an error and the call hierarchy, including filterable error traces, grouped by transaction name, and error class. You can also sort and drill into more detailed error information for a selected trace, including stack traces, default attributes and custom attributes from New Relic Insights that relate to the specific occurrence of the error. |
||
| Transaction Metrics and Traces
Metrics and data on the tiniest transaction detail levels—from your slowest individual HTTP requests to the SQL statement. |
||
| Thread Profiler
Low-impact production thread profiler lets you identify hot spots in your application. Stack traces are collected over a specified duration, aggregated, and displayed in a detailed call tree for fine-grained diagnosis. |
||
| Custom Instrumentation Editor
Allows Java users to define custom instrumentation via the New Relic user interface. With the editor, you can expand your Java app’s instrumentation without annotating your code or manually building a custom instrumentation file. |
||
| Weekly Performance Report
Every Monday, New Relic sends a weekly performance report via email to any of your account’s users who have selected to receive this report. The report contains summary performance metrics for the past week for a select group of your applications. |
||
| External Service Metrics
Captures calls to out-of-process services such as web services, resources in the cloud, and any other network calls. |
||
| JVM Metrics Page
You can use New Relic’s Java agent to collect and view additional metrics provided by the most common application servers via JMX. The collected metrics vary by application server and include measurements of heap memory, non-heap memory, garbage collection, and class count. |
||
| Key Transactions
Monitor, manage, and track the most important business transactions independent of the overall application. Set transaction-level alerting thresholds and access transaction specific dashboards, topology maps, and SLA reports. |
||
| Cross Application Tracing
Links transactions between APM apps in your service-oriented architecture (SOA). This is useful, for example, to identify performance problems between your own application (the “calling” app) and any internal or external services (the “called” app), such as traffic to internal services. |
||
| Service Maps
Provides a real-time visualization of your application and microservices architecture topology showing connections, dependencies, and real-time health status. |
||
| SLA Reports
Daily, weekly, or monthly SLA reports showing graphical trends over selected time periods to help you better understand and analyze where application performance is heading. |
||
| Deep JVM Monitoring
Access deeper JVM monitoring with additional JMX metrics including thread pools, HTTP sessions, and transactions. |
||
| Deployment Tracking
Tracks and marks deployments to your applications and captures a before-and-after snapshot of your app’s performance to help you understand the impact of an intended change. |
||
| X-Ray Sessions
Delivers deeper insights into a key transaction’s performance by showing transaction traces alongside long-running profiler results. |
| ESSENTIALS | PRO | |
|---|---|---|
Platform Features |
||
| Full-Stack Alerting
Provides a single tool to manage alerting policies for the New Relic Digital Intelligence suite, including third-party plugins. |
||
| Team-Based Alerting Policies
Gives team members the alerts they need faster to achieve lower response times with configurable incident rollups and prioritized search terms that are monitored and tracked. |
||
| Alerts integrations: PagerDuty, Slack, etc.,
New Relic Alerts integrates easily with team software like PagerDuty, Campfire, HipChat, Slack—and more—so you can immediately let the right people know when critical issues arise. Or, use webhooks to integrate with virtually any software. |
||
| New Relic Data APIs
Allows you to create customized queries on metric names and metric data, including application server response times, page load times, and number of transactions and page loads. Also provides data about error rates and application server performance. |
||
| SOC 2 Audited Service
New Relic has successfully completed a SOC 2 audit of processes and controls relevant to security and availability. This audit provides both our company—and more importantly—our customers, an independent, third-party assurance that we are taking the appropriate steps to protect our systems and customer data. |
||
| Advanced Alerts
New Relic Dynamic Baseline Alerts (Metrics and NRQL Baselines) enable customers to set dynamic thresholds for any metric or NRQL query based on historical data. |
||
| Enterprise Security Mode
Lets you lock down the available security options so that your employees can’t accidentally enable the transmission of sensitive data. |
||
| SSO/SAML Integration
New Relic supports Single Sign On (SSO) as a convenience for customers. Customers implementing SSO also have the option to restrict access by requiring customers to access New Relic via the customer’s management site or product login. |
||
| Multi-Account Management
Create a master account with sub-accounts for di erent applications. This is useful, for example, to limit users to viewing only apps relevant to their group. |
||
| Ticketing Integrations: JIRA, Pivotal, etc.
Integrate New Relic with Atlassian JIRA, Lighthouse, or Pivotal Tracker. This is useful to create tickets, issues, or stories about performance issues in New Relic’s transaction traces, errors, and notes. |
| ESSENTIALS | PRO | |
|---|---|---|
Data Retention |
||
| Metric Data
Time-series, aggregated metric data reported by your applications, servers, and plugins. |
3 days | 90 days |
| Key Metrics
Includes Apdex, throughput, response times, and error rates. These metrics are aggregated at a daily level after 90 days. |
Forever | Forever |
| Trace Data
Transaction traces, slow query samples, and error details. |
3 days | 7 days |
| Insights Events
Comes with your APM subscription and includes transactions and transaction errors events. |
3 days | 8 days |
| Insights Custom Events
Custom events stored into Insights via the Insights Insert API. |
1 day | 1 day |